
Types of Trading Candlestick Patterns
Introduction
Have you ever looked at a stock chart and wondered what those little red and green bars mean? These are called candlestick patterns, and they hold valuable clues about market trends. If you're new to trading, understanding candlestick patterns for beginners can be a game-changer. They help traders predict market movements and make informed decisions. In this guide, we'll explore the different types of candlestick patterns, making it easy for you to grasp and apply them in real-world trading.
Discover the essential candlestick patterns for beginners. Learn about different types of candlestick patterns and how to use them for trading success.
What Are Candlestick Patterns?
Candlestick patterns are visual representations of price movements in trading. Each candlestick shows the opening, closing, high, and low prices for a specific time frame.
Why Are Candlestick Patterns Important?
Candlestick patterns help traders analyze market trends and predict future price movements. They provide insights into buyer and seller sentiment, making them a crucial tool for decision-making.
Basic Candlestick Structure
A candlestick consists of three parts:
Body: Represents the opening and closing prices.
Wick (Shadow): Shows the highest and lowest prices.
Color: Green (or white) indicates a bullish trend, while red (or black) signals a bearish trend.
Types of Candlestick Patterns
There are numerous types of candlestick patterns, broadly categorized into bullish, bearish, reversal, and continuation patterns.
Bullish Candlestick Patterns
Bullish patterns indicate a potential upward movement. Some common ones include:
Hammer: A small body with a long lower wick, signaling a possible reversal.
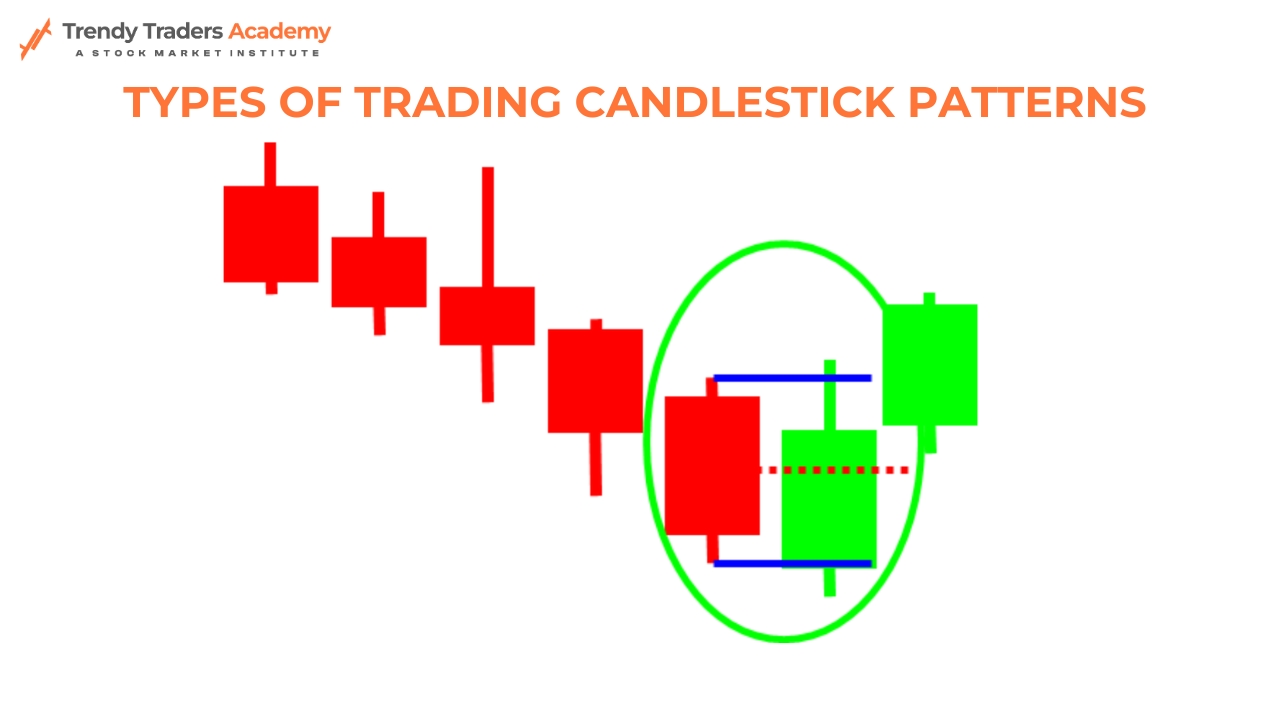
Bullish Engulfing: A larger green candle engulfing a smaller red candle, indicating buying pressure.
Morning Star: A three-candle pattern suggesting the end of a downtrend.
Bearish Candlestick Patterns
Bearish patterns suggest a potential downward trend. Examples include:
Shooting Star: A small body with a long upper wick, indicating selling pressure.
Bearish Engulfing: A large red candle engulfing a smaller green candle, signaling a reversal.
Evening Star: A three-candle pattern marking the end of an uptrend.
Reversal Candlestick Patterns
These patterns indicate a shift in market direction:
Doji: A candle with little to no body, showing market indecision.
Piercing Line: A bullish reversal pattern where a green candle closes above the midpoint of a previous red candle.
Continuation Candlestick Patterns
Continuation patterns suggest that the current trend will persist:
Three White Soldiers: Three consecutive green candles signaling a strong uptrend.
Three Black Crows: Three consecutive red candles indicating a strong downtrend.
Single Candlestick Patterns
Single candlestick patterns are easy to identify and provide quick signals:
Spinning Top: Indicates indecision in the market.
Marubozu: A candle without wicks, signifying strong momentum.
Multiple Candlestick Patterns
These involve combinations of two or more candles:
Harami: A smaller candle within the previous candle’s body, indicating a possible reversal.
Dark Cloud Cover: A bearish reversal pattern with a red candle closing below the midpoint of a previous green candle.
How to Use Candlestick Patterns in Trading?
To effectively use candlestick patterns, traders must:
Confirm patterns with other technical indicators.
Consider the overall trend before making decisions.
Use proper risk management strategies.
Common Mistakes to Avoid
Relying solely on candlestick patterns without confirmation.
Ignoring market context.
Overtrading based on weak signals.
Best Practices for Beginners
Start with paper trading to practice.
Combine candlestick analysis with support and resistance levels.
Keep emotions in check and follow a trading plan.
Conclusion
Candlestick patterns are a powerful tool for traders, helping them predict market movements with greater accuracy. While no pattern guarantees success, understanding different types of candlestick patterns can significantly improve decision-making. As a beginner, focus on mastering the basics before diving into complex strategies.
FAQs
What is the best candlestick pattern for beginners?
The Hammer and Bullish Engulfing patterns are great starting points as they are easy to identify and indicate potential trend reversals.
Can candlestick patterns predict stock prices?
Candlestick patterns provide insights into market trends but should be used alongside other indicators for accurate predictions.
How many types of candlestick patterns are there?
There are dozens of patterns, but traders typically focus on bullish, bearish, reversal, and continuation patterns.
Are candlestick patterns reliable?
While not foolproof, candlestick patterns are widely used by traders to make informed decisions when combined with other technical analysis tools.
How can I learn candlestick patterns quickly?
Practice by analyzing charts, studying real-world examples, and using demo trading accounts to apply your knowledge.


