
Many IT parks and startups in Noida now hire people with Salesforce skills. This means more demand for skilled admins and developers. A lot of learners begin with a Salesforce Admin Course to build their base, but most struggle when they face Apex code failures.

Apex is the coding language used in Salesforce. It works in a special environment called multi-tenant, where many users share the same platform. Because of this, Apex follows strict rules like governor limits. But they also cause many errors that new developers don’t understand.
When Apex code fails, the reason is not always clear. A basic error message may not explain the full problem. That’s why debug logs are a powerful tool.
How Apex Code Fails — Not Always Due to Bad Code?
Let’s look at a basic example. You have a trigger on the Opportunity object that looks for a matching Contact by email.
apex
CopyEdit
trigger MatchContact on Opportunity (before insert) {
for (Opportunity opp : Trigger.new) {
Contact c = [SELECT Id FROM Contact WHERE Email = :opp.ContactEmail LIMIT 1];
opp.Contact__c = c.Id;
}
}
This seems fine. But it will crash if there’s no contact with that email. The system throws an error:
System.QueryException: List has no rows for assignment to SObject
This doesn’t mean your code is wrong. It means your logic doesn’t handle all cases. In real apps, this can be hard to catch. That’s where debug logs help.
What Debug Logs Actually Show?
When your code runs, Salesforce creates a log. This log shows every event, method, and query step-by-step.
Here's a simple table showing what key parts of the debug log mean:
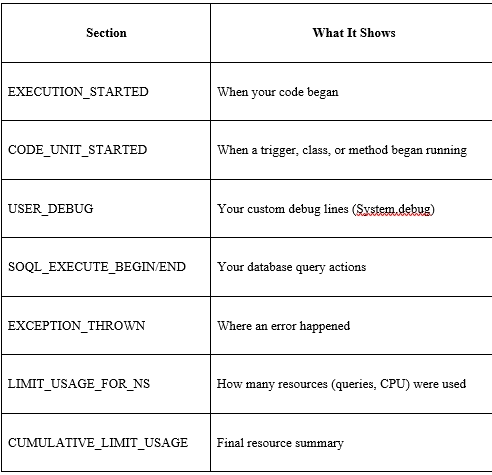
These logs help you find the exact line or limit that caused the issue.
Technical Failures: It’s Not Always an Error
Not all failures throw an error. Some just stop working because they use too many resources. Apex has strict rules called governor limits. For example, you can’t have more than 150 DML operations in a single execution.
Example:
for(Account acc : [SELECT Id FROM Account LIMIT 1000]) {
insert new Contact(LastName='Test', AccountId=acc.Id);
}
This looks fine, but it will fail with:
System.LimitException: Too many DML statements: 151
To catch this early, look at the CUMULATIVE_LIMIT_USAGE section in the debug log. It shows what part of the code is using too much memory or CPU.
Apex Execution Flow — Explained with a Chart
Here’s a chart that explains the steps that happen when Apex code runs:
[Start] --> [Trigger or Class Starts]
--> [SOQL/DML Executes]
--> [System.debug Logs Output]
--> [Governor Limits Monitored]
--> [Error Thrown or Code Ends]
--> [Commit or Rollback]
This shows that every Apex run follows the same lifecycle. Errors can happen at any step.
What’s Special About Debugging in Noida?
In Noida, many Salesforce projects are built fast for big clients. Developers work in teams with short delivery cycles. This causes rushed code with missing bulk handling or poor SOQL optimization. Most junior devs trained from regular programs like a Salesforce Developer Course may not be prepared for this.
That’s why many professionals in this city are joining programs like Salesforce Developer Training. These courses teach real-world debugging, log tracing, and working under governor limits — skills you don’t get from books.
Also, in Noida, teams often face mixed errors — caused by Apex, Flows, and third-party tools all working in one transaction. These errors are hard to trace unless you know how to read logs in detail.
Best Ways to Use Debug Logs
To catch Apex failures early, follow these steps:
● Add System.debug() in your code to print variable values.
● Check CUMULATIVE_LIMIT_USAGE often to monitor limits.
● Use Developer Console to set breakpoints and view logs.
● Always trace logs per user.
● In sandboxes, use logs to compare working vs. broken code paths.
Also, if your code behaves differently for some users or data, increase log level to FINEST. This shows deeper details.
What You Learn Beyond a Developer Course?
A regular Salesforce Developer Course teaches you how to write Apex. But debugging needs real-time thinking. Logs show how your code actually behaves — not how you think it should. That’s a big difference.
They also learn how to find hidden bugs that appear only under load. This is very useful in real company projects.
Sum up,
Apex errors aren’t always obvious. They may not throw an error at all. Debug logs help you track what happened at every step of code execution. Governor limits often cause hidden failures. Logs show these clearly. In busy cities like Noida, real-world debugging is more complex due to tight deadlines and large data volumes. Advanced training such as Salesforce Developer Training in Noida teaches you how to handle these situations smartly.


