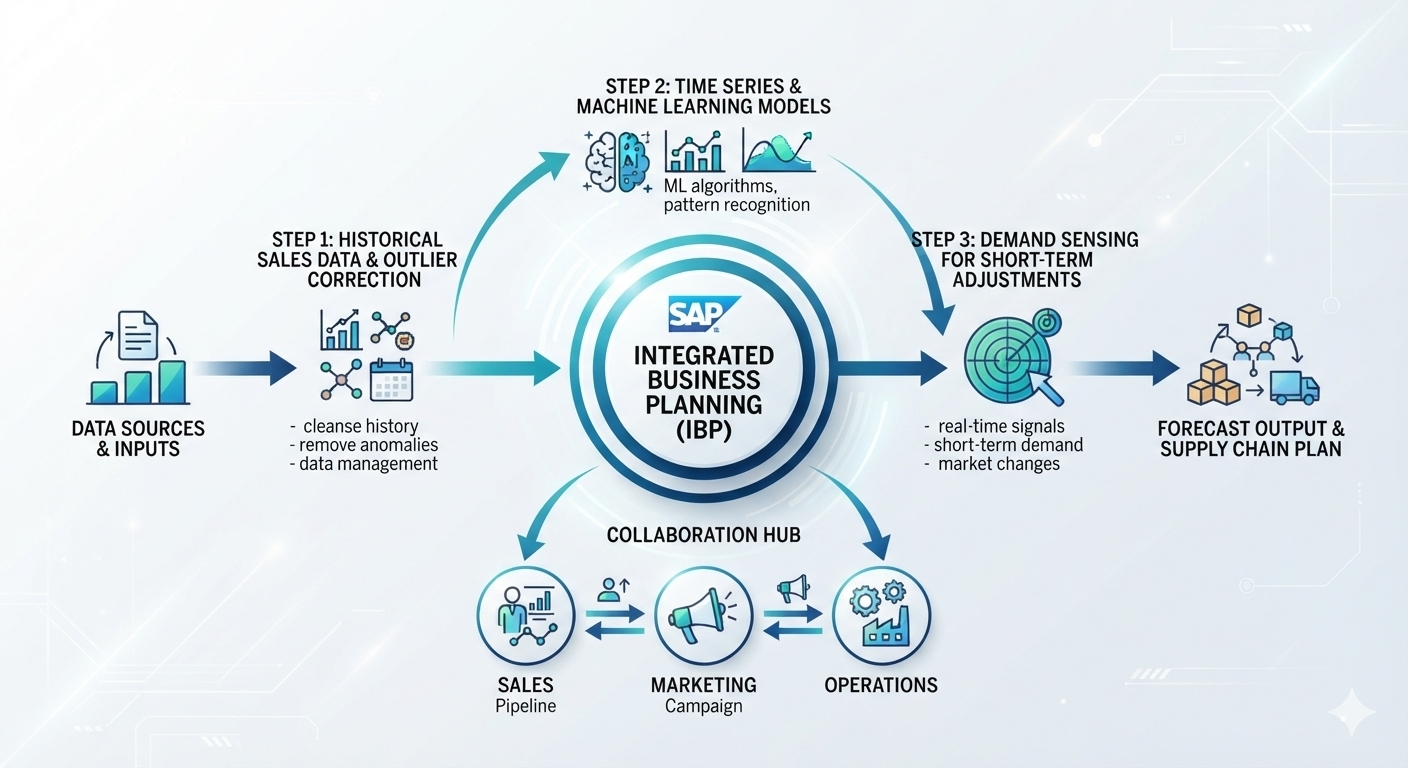
It will never be easy to forecast demand from consumers. It changes its mind all the time, and suppliers are always late. That’s why a warehouse can be full, and the shelves containing the needed products can be empty. Once, our group had spent a few weeks arguing over one number, but it was missed anyway. This is why connected planning is important. It connects the demand forecast to production, purchasing, and delivery. Therefore, once a team forecasts the demand, this becomes everybody’s action plan.
If you are taking an SAP Supply Chain Management Course, this will be the main subject of your course syllabus. Each phase builds upon the previous one. This is why order is important. Below, I provide an explanation of the process.
SAP IBP as the Foundation of Integrated Demand Planning
Demand planning, statistical forecasting, demand sensing, and supply planning processes happen in one place. Data is stored in planning spaces. Every space includes products, locations, customers, time periods, and key figures. Key figures can be sales quantity or forecast value. Since everyone uses the same place, all people use the same numbers. Therefore, there is no need to exchange spreadsheets through emails.
Creating a Reliable Forecast on the Basis of Historical Business Data
A forecast can be only as reliable as its historical base. First of all, sales history, order history, shipping history, and products get into the game. After that, planners sort out this information with the help of master data and planning levels such as product family or region. Cleansing starts with:
Fill gaps where values are missing
Correct outliers, like a one-off bulk order
Adjust for past promotions or stockouts, which hide true demand
Cluster similar patterns to consider seasonal vs. regular products differently
Failure to perform this process will lead the model astray. Thus, data cleansing precedes the analysis.
Generating the Initial Demand Forecast Through Statistical Models
This is the technical core. Here, the system applies forecasting models to cleaned history. Then it calculates expected demand. Algorithms detect trends, seasonality, and recurring cycles. The parameters in the model define the sensitivity of each algorithm to recent changes. Planners choose models based on product behaviour. If you plan to join an SAP SCM Certification Course, learn this matching logic well.
Demand pattern | Typical approach | Example product |
|---|---|---|
Stable, flat | Single exponential smoothing | Packaging tape |
Rising or falling | Trend-based model | Growing subscription kit |
Repeating peaks | Seasonal model | Winter clothing |
Sporadic | Intermittent-demand method | Spare parts |
The calculation then runs in three stages:
Preprocessing: prepares the cleaned history
Forecast calculation: runs the assigned model
Postprocessing: applies final corrections and rounding
The result is a baseline for local demand planners. They review it in planning views. If the numbers ignore business reality, they adjust them.
Refining the Forecast With Recent Demand Signals and Market Information
The past cannot detect a sudden change in consumer behaviour. This is when demand sensing comes into play. It enhances short-term forecasting with the help of recent sales orders and shipping. At the same time, sales and marketing teams provide information that cannot be calculated by any type of algorithm. This information is then combined with the statistical forecast.
Statistical forecasting | Demand sensing | |
|---|---|---|
Horizon | Medium to long term | Short term |
Data used | Historical patterns | Latest orders and deliveries |
Purpose | Baseline plan | Quick correction |
To sum up, the two methods go hand in hand.
From Local Forecasts Adjustment to the Development of a Consensus Demand Plan
First, local planners adjust quantities using regional, product, or customer knowledge. Next, those local plans roll up into broader global plans. Third, the demand review starts. The representatives from sales, marketing, finance, and supply chain discuss the forecast. Their opinions do not converge. Statistical predictions, sales hopes, and financial targets often pull apart. However, the group works through each gap. In the end, everyone accepts one consensus demand plan. All later planning steps then use that figure.
Changing the Approved Demand Plan into Supply Requirements
Now supply planners take over. They see to it that the resources will be able to fulfill the agreed demand. This involves consideration of inventory, capacity, sourcing policies, lead time, procurement requirements, and many more. Inventory optimisation then sets sensible stock targets. If supply falls short, planners change production and distribution plans. Learners on a SAP SD Course will see the link here, because sales order data feeds this loop.
Quick Example: A drinks company anticipates an increase in demand during the summer season. The forecast indicates that there will be a 40 percent increase in June, but because the bottling capability is capped at a 25 percent increase, the team implements another shift and creates inventory in May.
Checking Forecast Accuracy and Plan Adjustments
The next step in planning is comparing forecasts with the actual sales to identify mistakes. There are accuracy metrics and alerts which signal significant differences immediately. “What-if” scenarios help to examine plan adjustments. For example, this could consist of an increase in demand, supply problems, and limited capacity. Lastly, the team changes the assumptions and analyses alternative solutions.
Conclusion
Well-done planning takes a specific route. First, you create the history. Secondly, you develop the statistical baseline. Then, you improve it with new signals and come to a single demand plan. Finally SAP SD Certification Course supply side implements the plan. The connection between the steps is what makes the whole process valuable. Nevertheless, nothing comes close to the behavior that surrounds the feature. Reliable data, proper model selection, regular reviews, and real cooperation ensure the process. Once this happens, the forecasts become decisions instead of debates.