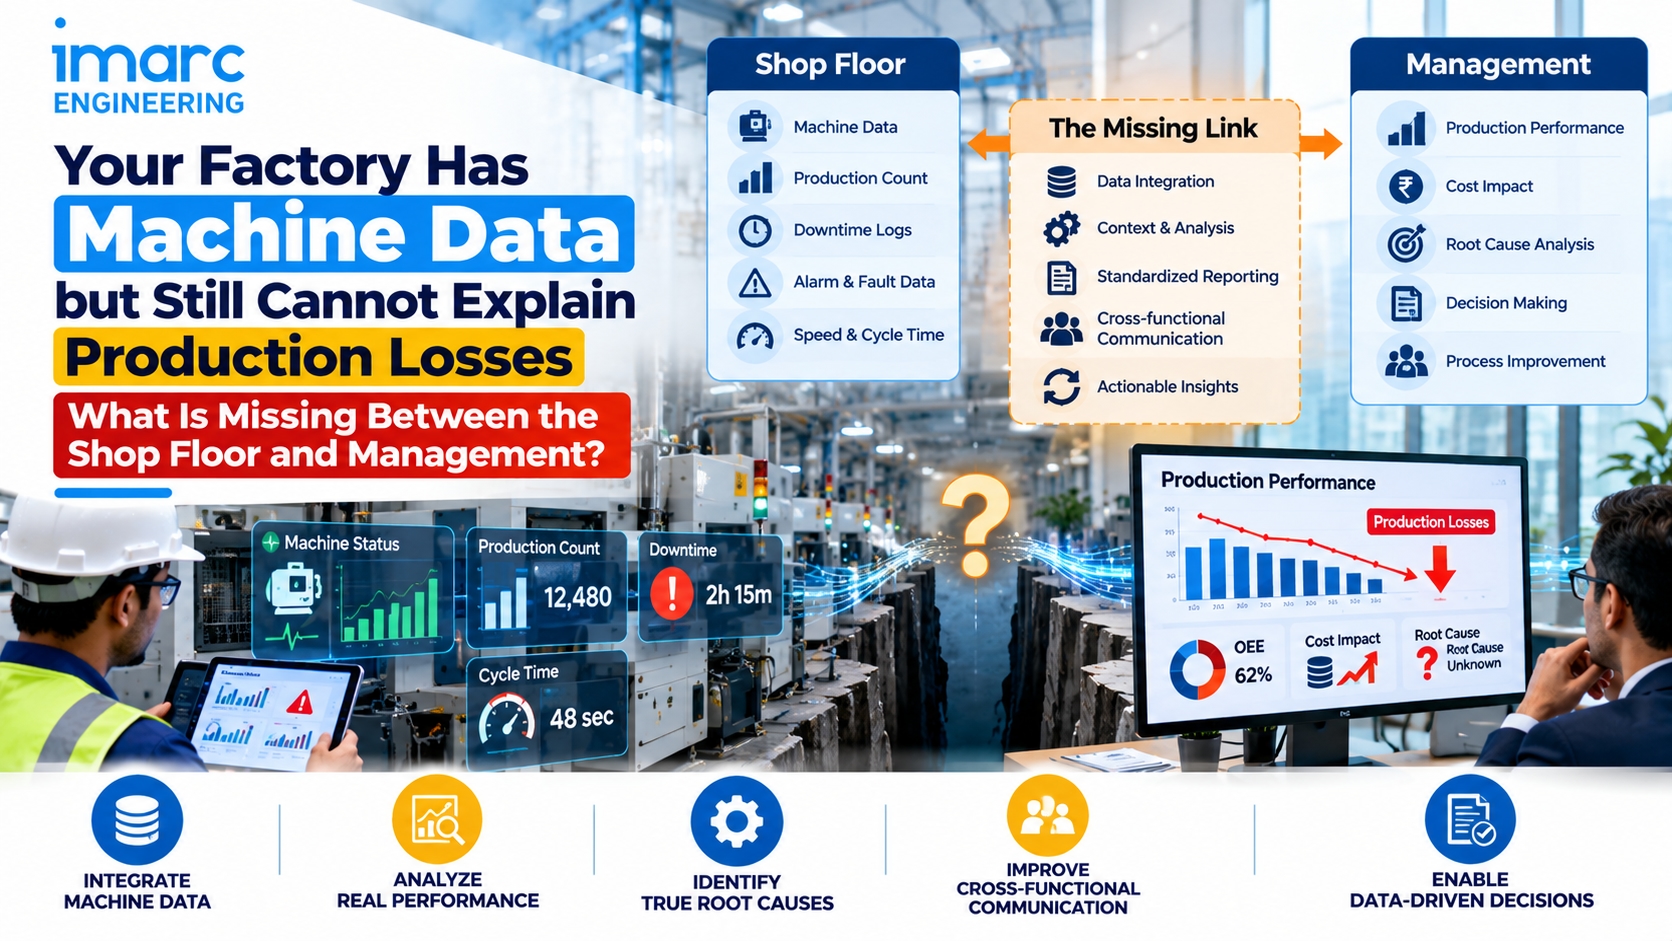
Counters tick. HMIs show status. A dashboard lights up green and red. At the daily meeting, the question is the same: why did we lose output yesterday? The answers stay vague— “stops,” “quality,” “material”—with no shared story that connects machine events to lost units, lost time and lost money.
Having machine data is not the same as explaining production losses. What is missing between the shop floor and management is usually context, loss structure, data quality and a closed loop from signal to action—not another screen. Industry 4.0 consulting services in India can help manufacturers assess how operational data, connected systems and production insights can support better manufacturing decisions.
What “Cannot Explain Losses” Looks Like in Practice
Typical symptoms:
OEE or output numbers exist, but reasons are free-text or missing
Stops are visible; causes are not coded consistently
Quality rejects appear in one system, downtime in another, with no link
Shift reports and digital dashboards disagree
Management sees averages; supervisors remember incidents; neither reconcilable
Improvement projects start from opinion because loss ranking is untrusted
The plant is data-rich and insight-poor.
Why Machine Data Does Not Explain Losses
1. Signals lack business context
A machine reports “stopped.” It does not say whether the stop was planned changeover, waiting for upstream material, a fault, or a quality hold. Without reason codes and product/order context, the signal is noise for management.
2. Loss categories are not standardised
Each shift invents language. “Jammed,” “sensor,” “waiting,” “quality” overlap. Pareto analysis becomes meaningless.
3. Time and count definitions differ by system
Runtime from the PLC, downtime from a logbook, and output from ERP use different clocks and boundaries. Reconciliation fails before explanation starts.
4. Only availability is instrumented
Speed losses and quality losses are under-measured. The dashboard highlights hard stops and hides the chronic losses that often dominate.
5. Data is not owned
IT owns the platform, maintenance owns the sensors, production owns the narrative. When numbers look wrong, nobody is accountable to correct tags, codes or master data.
6. No decision cadence uses the data
Reports are reviewed weekly as history. There is no short-interval response that tests whether the explanation was right.
What Must Sit Between Shop Floor and Management
Bridging the gap requires four layers working together.
1. Trusted capture at the source
Run status, counts, and—where possible—automated fault codes must be reliable. Manual entry can supplement reasons; it cannot be the only source of stop time if credibility matters.
2. A common loss model
Agree a small, stable set of loss categories (e.g. breakdown, changeover, minor stops, reduced speed, defects/rework, planned downtime). Train to it. Audit coding quality.
3. Context keys
Every loss event should carry machine/line, time window, product or order, shift and, when relevant, material batch. Context turns “two hours down” into “two hours on Line 3 during SKU change after film supplier switch.”
4. A management view built for decisions
Leaders need ranked losses, trends and a clear owner for the top issues—not raw tag streams. Supervisors need the same model on a shift horizon so action matches the review language.
How to Diagnose the Gap and Close It
Pick one line and one week of losses
Reconstruct output shortfall from first principles: available time, ideal rate, good count. Compare to what systems reported.List every stop and speed/quality loss you can evidence
Use machine logs, SCADA, quality records and shift notes. Mark where reason is missing or contradictory.Score data quality
Completeness of reason codes, consistency across shifts, match between counters and ERP shipments or WIP.Map systems and handoffs
Where does a stop originate? Who codes the reason? Which system feeds the management dashboard? Where does the chain break?Install or repair the minimum viable loss structure
Standard reason codes, mandatory coding for stops above a threshold, product context on the line, daily reconciliation of top losses.Run a short-interval control routine
Shift review of top three losses with actions. Weekly management review of persistent losses only—using the same categories.Improve automation only where it removes real blind spots
Auto-capture of run/stop and counts usually pays first. Elaborate analytics wait until basic explanation works.
Practical Scenarios
Scenario A: Green dashboard, red production
Machines show high “run” time because idle waiting was not distinguished from producing. Output is low; the dashboard never explained waiting for materials.
Scenario B: Free-text chaos
Hundreds of unique stop descriptions. No Pareto. Maintenance and production argue from anecdotes.
Scenario C: OEE without quality
Availability looks acceptable. Defects and rework sit in a separate QMS. Total loss is understated until both are combined.
Scenario D: Same model, two horizons
Supervisors code losses hourly; managers review the same codes weekly. Actions stick because the language matches.
Decision Point: More Sensors or Better Structure?
Ask:
Can we already explain yesterday’s top losses in one agreed language?
Do speed and quality losses appear in the same model as downtime?
Who is responsible when reason-code quality collapses?
Will another dashboard change behaviour if coding and context stay weak?
If the answer is structure and ownership, buying more machine data will not fix the meeting.
Checklist: From Machine Data to Loss Explanation
Standard loss categories defined and trained
Run/stop and good-count signals trusted on priority lines
Reason coding mandatory and audited for major stops
Product/order/shift context on loss events
Speed and quality losses included, not only hard stops
Daily/shift review using the same model as management reports
Clear owner for data quality on each line
Top-loss actions tracked to closure
ERP/MES and shop-floor counts reconciled at a defined frequency
New analytics only after basic explanation is credible
When to Fix the Bridge
Address the gap:
when digital OEE exists but improvement priorities keep shifting
before expanding Industry 4.0 spend on more tags and platforms
when shift reports and system reports cannot be reconciled
when customer OTIF or cost issues demand ranked loss action
when new lines are added—standardise the loss model from day one
Waiting for a perfect data lake delays the operating discipline that makes any lake useful.
How IMARC Engineering Can Help
IMARC Engineering supports manufacturers who have machine signals but still cannot brief leadership on why volume was lost. Smart factory and Industry 4.0 integration can help align capture, loss structure and operational review so shop-floor events become management decisions.
Relevant support can include connecting data to operational control through smart factory and Industry 4.0 integration.
Talk to IMARC Engineering if production losses remain unexplained despite machine data and you need the missing link between shop-floor signals and management action—not another disconnected dashboard: https://www.imarcengineering.com/contact?service=smart-factory-industry-4-integration
Conclusion
Machine data explains production losses only when events are coded in a shared loss model, tied to product and time context, and reviewed on a cadence that drives action. Without that bridge, management sees charts and the shop floor remembers incidents—and neither side trusts the other.
Teams that standardise losses, fix capture quality and close the loop convert data into priorities. Teams that only add sensors stay busy and still cannot answer why yesterday failed.
The practical takeaway is clear: do not ask for more machine data until you can explain the last week’s top losses in one language both the line and the leadership board recognise.
Contact Us:
IMARC Engineering
Phon:e +91-120-433-0800
Email: sales@imarcengineering.com
India: C-130, Sector 2, Noida, Uttar Pradesh 201301
LinkedIn: https://www.linkedin.com/showcase/imarc-engineering/